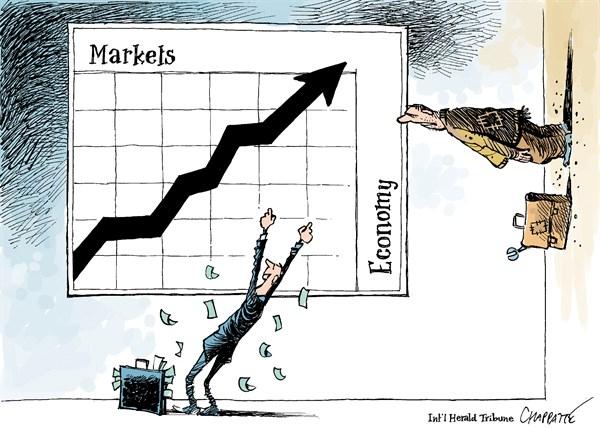
Do the Markets reflect the Economy?
August 25, 2013 7:00 amFrom time to time we like to review some of our old reading material. On Friday afternoon we found some statistics from earlier this spring that were so “slap you in the forehead” obvious that we thought it was worth revisiting. What struck us was the fact that media outlets always seem to focus on stock market performance. So today we ask you – do the markets reflect the economy today?
Just pick up your iPad and read the headlines form the main stream media. All suggest that the US economy is getting better by the day and the road to recovery is clear and without obstacles… In fact things are apparently going so well that the economy is now healthy enough to grow on it’s own without stimulus from the Fed. Hey, we like the sound of that! But is it the whole story?
In fact, gauging the markets to get a sense of the economy is really a poor practice – mostly for this simple reason: the markets are not the economy.
All of these headlines are understandable if you want to measure the “success” of QE programs and the “health” of the economy solely by where the stock market is. After all, the DOW peaked at 14,164 before the crisis of 2008, and now it’s at 14,986. So by that measure… we’re back baby!
Feels great to be back doesn’t it…?
But what if we used big picture, macro-economic statistics as the measuring stick? What would the story be then?
Let’s take a look at some economic indicators from earlier this year and compare them to how things were before the great recession of 2008 started. We all know the stock market is “back” but this will tell us if the actual economy as a whole is back as well. The following figures are a comparison from the market peak before the crash, to the end of Q1 2013 (the “Now” numbers are outdated by a few months, but still get the point across.)
For the sake of comparison we’ll call “then” October of 2007 and we’ll call “now” March 2013 (in order to work with dependable statistics).
Let’s take a look:
Regular Gas Price: Then $2.75, Now $3.73
GDP Growth: Then +2.5%, Now 1.6%
Americans on Food Stamps: Then 26.9 million, Now 47.69 million
Size of Fed Balance Sheet: Then $0.89 trillion, Now $3.01 trillion
US Debt as a percentage of GDP: Then ~38%, Now 74.2%
US Deficit: Then $97 billion, Now $975.6 billion
10 Year Treasury Yield: Then 4.64%, Now 1.89%
So… gas is about $1.00/gallon more expensive, GDP growth is almost a full percentage point below where it started, the number of citizens on food stamps has nearly doubled, the Fed balance sheet has tripled (QE 1, 2, and 3), debt to GDP has nearly doubled, and rather than the government overspending the budget by ~$100B/year, we’re now overspending by ~$1T/year. Wow.
These statistics really drive home the point that “the market is NOT the economy.”
Has Wall St. recovered? You could say so. Does that mean that as a country we are out of the woods and on the fast track back to the boom days? Not even close.
Tags: Debt, Deficit, Dow Jones, Economy, Fed, Gas, GDP, QE, Stock Market, TreasuryCategorized in: Blog
This post was written by Conscient Capital


